/vis/a000000/a005000/a005017/salinity_v49_1000p30.mp4 type=video/mp4>
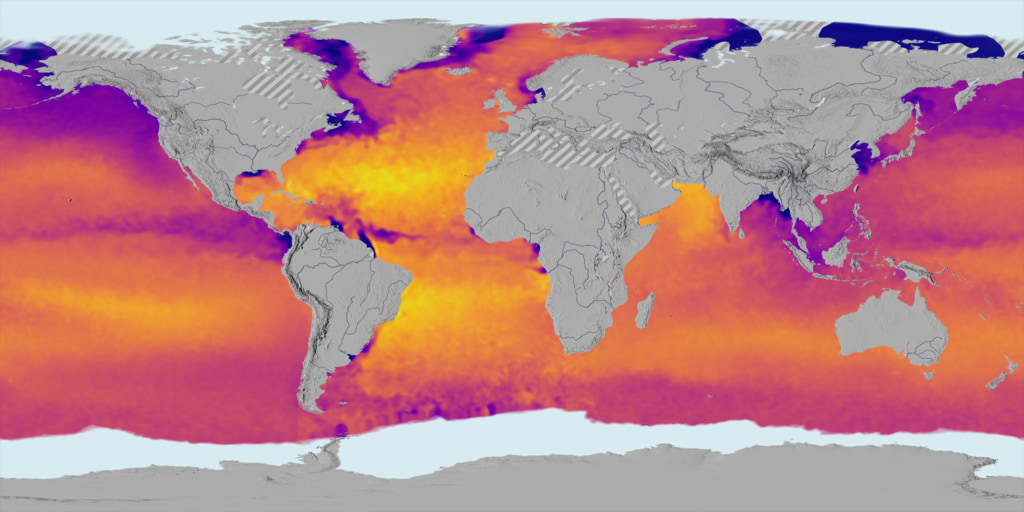
This data visualization shows sea surface salinity (i.e., ocean salt concentration) over a ten year period (2011 to 2021). Warm colors (orange to yellow) are areas of high salinity/hot tropics. Cooler colors (blue to violet) are fresher waters, many of which can be seen coming from rainy/river/wetter tropics.